
Statistics
Introduction
During this semester, I would like to learn more about statistics and its application. In doing so, I want to learn how to interpret data, analyze it, and draw conclusions. This by setting up hypotheses and testing them. I would like to learn all this so I can apply it in my own projects. This will also come in handy for my follow-up study "Data Science" that I want to follow at the TUe. In the statistics course I will make a link with the Cyber subject by doing an analysis on Cyber related data. This means I'm going to look for correlations between certain labels that have to do with, for example, malware. To show that I can apply the knowledge I have learned, I will analyze a dataset and present the data clearly and above all to people who are interested in it. In order to apply statistics, a thorough knowledge of the mathematical formulas behind the analysis of these data is required. I learn this mathematics by following the course on "Khan acandemy". By attending the lessons given by Peter Lambooij, a teacher at Fontys, I will make my knowledge measurable. During the lessons, we work on a project; we have to apply the knowledge we have learned. I am going to demonstrate this learning goal by showing the results and outcomes that have been released by Peter Lambooij. The results of the knowledge gained from the subject of statistics can be seen in the research. This research was conducted as a project within the subject of statistics.
Evaluate
Version (1)
Below are the results of that were obtained in the unit tests of the subject of statistics:
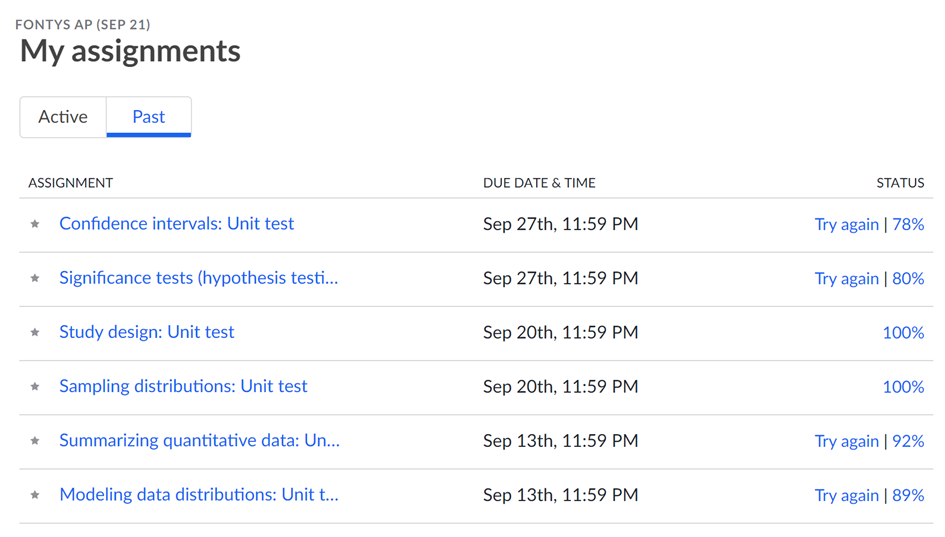 Above is the current status of the unit tests created for the subject of statistics. The unit tests were taken on the Khanacademy platform. As seen above, all unit tests were passed with a minimum score of 70% or higher. Since the workload is very high, it was difficult to keep up with all the material that was given each week. Also, the material itself was very difficult and sometimes hard to understand. During these first weeks I learned what the subject of statistics is and when and what it is used for. I also learned what static research is and the formulas that go with it by making hypotheses.
Khan academy - statistics-probability
Version (2)
In my previous evaluation I showed my results from the beginning to the middle of the course. In this evaluation I have now finished the course and both my project and my khan unit have been evaluated. The given results are shown below:
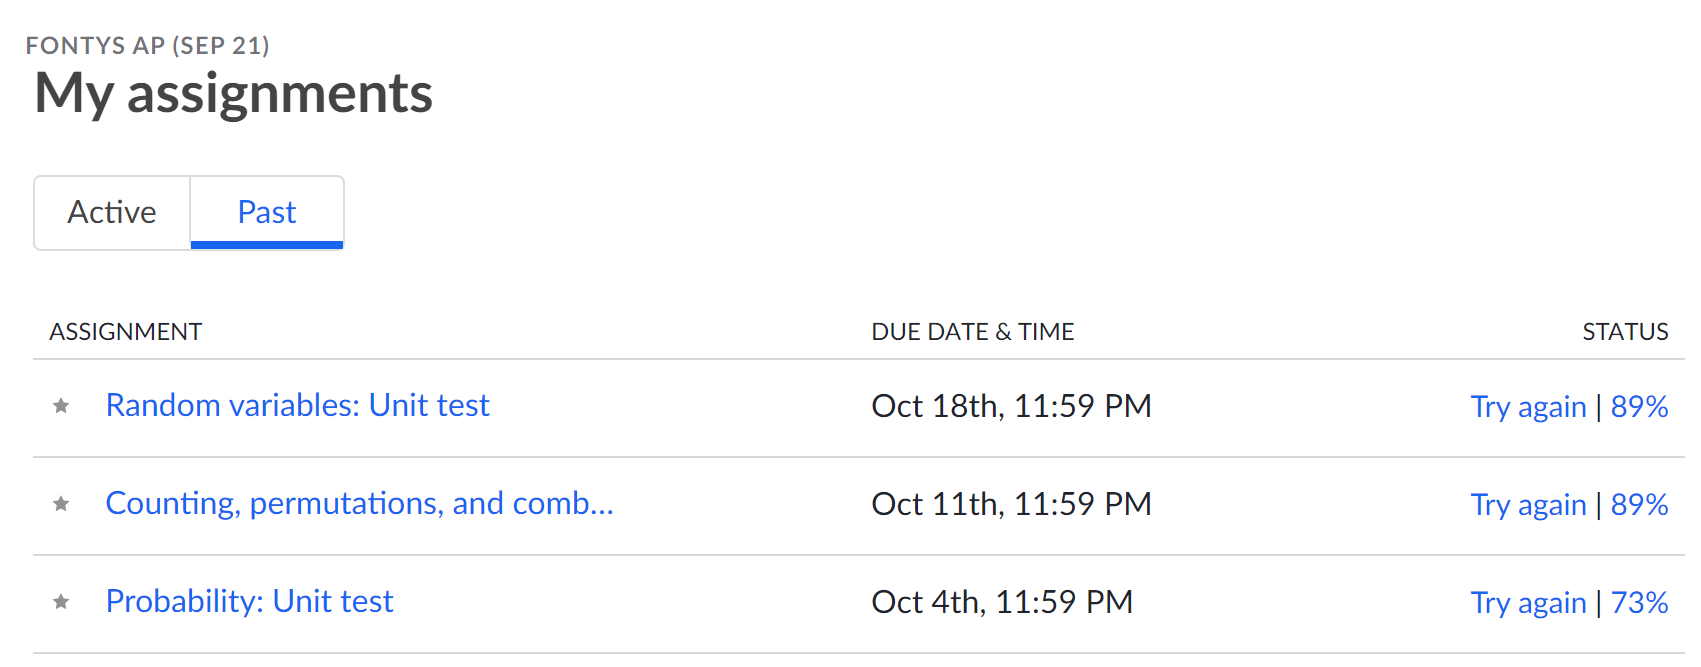
I am very happy that I was able to attend this course. It has taught me a lot and has contributed greatly to the continuation of my studies. Even though I find the formulas difficult to apply within real examples at the moment. The remaining weeks of this minor I want to make these formulas my own so that they are engraved in my brain.
Assignments
Research project
Conduct scientific research by establishing hypotheses, analyzing and concluding.
The detailed research can be read in the research document an abbreviated version of this with executable code in also obtainable by reading out the Jupiter notebook.
Gibbarish URL makes malware significantly more likely to occur
H0 - There is no correlation between a specific URL construction and a malicious label.
H0: Gibberish ≠ malicious
H1 - There is a correlation between a specific URL construction and a malicious label.
H1: Gibberish = malicious
Javascript volume makes malware significantly more likely
H0 - There is no correlation between javascript volume and a malicious label.
H0: code volume ≠ malicious
H1 - There is a correlation between javascript volume and a malicious label.
H1: code volume = malicious
Conclusion
Javascript volume makes malware significantly more likely
The study showed that there is a causal relationship between the volume of javascript loaded and the likelihood of malicious or a rogue site.
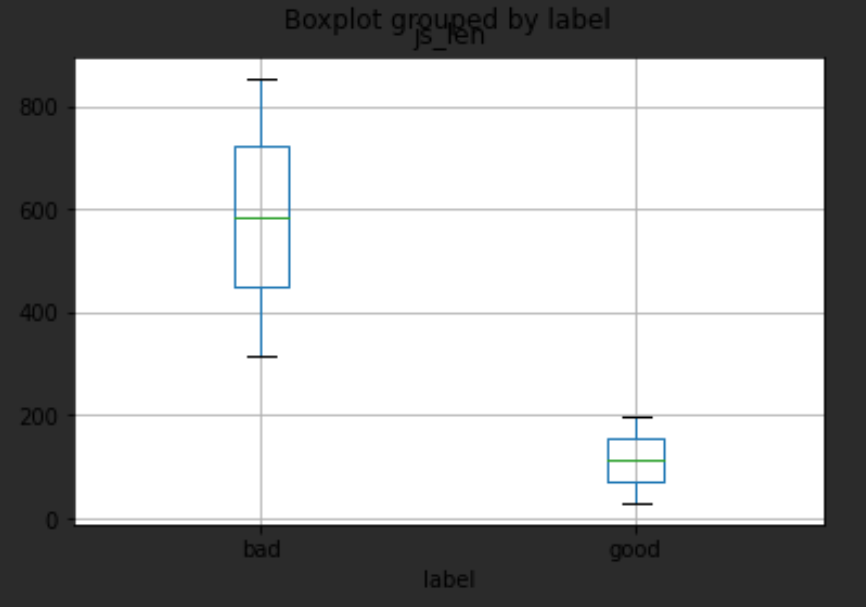
| count | mean | std | min | 25% | 50% | 75% | max | |
|---|---|---|---|---|---|---|---|---|
| label | ||||||||
| bad | 7684.0 | 584.931481 | 156.729323 | 315.0 | 448.2 | 584.1 | 721.8 | 854.1 |
| good | 336151.0 | 114.667426 | 49.144527 | 30.0 | 72.0 | 114.5 | 157.5 | 199.5 |
Recourses:
Research
Introduction
These days, everyone has had problems with malware, but how does this malware actually get onto a particular PC? In most cases, this is due to a "drive by download" attack. When a victim visits a site, an installation is performed in the background without the user being aware of it. During this research I will investigate whether there is a correlation between malware and a gibberish URL and whether the amount of code that is loaded can have an influence on this. From this research I hope to find a correlation between these domains. Also, this research will address which Supervised machine learning algorithms were applied to achieve a desired result. This includes explaining why a particular algorithm may have a preference on a particular analysis. During this research, I am using the dataset SINGH, AMIT KUMAR (2020), "Dataset of Malicious and Benign Webpages" ; The dataset contains extracted attributes of websites that can be used for classifying web pages as malicious or benign. The dataset also contains raw page content, including JavaScript code, which can be used as unstructured data in machine learning or for extracting further attributes(SINGH, 2020). The purpose of this research is to warn users about links that use a certain structure. Therefore, the research question reads as follows: "Is there a correlation between "drive by download malware" and gibberish URLs and/or the amount of code loaded by the respective web page". During this (correlational) research I will check if I can show a correlation between "drive by download" malware, "gibberish" URL web address and the amount of code also called code volume.
Context
Today, the likelihood of having encountered malware and, in particular, the "drive by download" type, is increasing. A drive by download exploits vulnerabilities in the browser used by a victim. "Drive by download" website are put online for one purpose only infecting as many computers as possible that visit their web URL. There are three ways to come into contact with this type of malware. Possibility one is the well known phenomenon of fishing where the victim receives an email and is encouraged to click on a redirect button after which the victim is redirected to the malicious website and infected. Possibility two is that the user is tricked into visiting a particular site via fake advertising, usually these sites are taken over or hacked and these advertising sites are abused for malicious purposes without the owner's knowledge. Usually all these sites look harmless. Way three maybe a relevant person receives a link in an email, a text message or a message on social media telling them to check out something interesting on a site. When one opens the page, while enjoying the article or cartoon, the download installs itself on the computer (McAfee, 2012). Is there a correlation between a malware infection and a malicious site code volume. By this we mean how much code the website leaves in. We know what a "drive by download ̈ ıs by definition. Hereby we can conclude that a this malware type can cause a lot of unknowing damage. This research does not explain how a "drive by download" works in the background and the mechanism of this malware type. The overall hypothesis is as follows: with this research we hope to find a correlation between the defined labels.
Gibbarish URL maakt de kans op malware aanzienlijk
H0 - Er is geen correlatie tussen een specifiek URL opbouw en een kwaadaardig label.
𝐻0:gibbarishurl≠kwaadaardig
H1 - er is een correlatie tussen een specifieke URL opbouwe en een kwaadaardig label.
𝐻1:gibbarishurl=kwaadaardig
Javascript volume maakt de kans op malware aanzienlijk
H0 - Er is geen correlatie tussen javascript volume en een kwaadaardige label.
𝐻0:javascriptvolume≠kwaadaardig
H1 - Er is een correlatie tussen javascript volume en een kwaadaardige label.
𝐻1:javascriptvolume=kwaadaardig
Hypothesis Testing
To test the hypothesis described above we are first going to prepare our dataset for analysis. We do this by reading the dataset and extracting the necessary labels from the dataset Then we split the data into two groups. A group with malicious web links and a group with benign web links.
Graphs:
https://github.com/rikp777/stat_project/blob/master/stat_project.ipynb
Conclusion
Javascript volume makes malware significantly more likely
The study showed that there is a causal relationship between the volume of javascript loaded and the likelihood of malicious or a rogue site.
Appendix
Mail contact
Agreement to attend external classes
To: j.geurts@fontys.nl
Subject: Attending Tav
Dear, Joris
I am currently doing the minor in Cyber Security.
After this minor and graduation I would like to do the pre-master "Data science & ai" at the tue.
In order to do this pre-master I need to prepare myself well and I need to take a number of courses in my spare time.
So this is what I am currently doing.
The following courses I need before I can start the pre-master, with an indication of the study load. These courses consist of:
- Mathematica B - 12 hours a week.
- (1) Linear algebra - 10 hours in the week
- (2) Statistics - 3 hours in the week
- English C1 Cambridge (New 2021) - 3 hours in the week
Optional courses: (1) or (2)
In addition, I also want to prepare in advance for the courses that will be given during this pre-master, these are for example: - Logic - 2.5 hours per week
- Data structures - 2.5 hours per week
My question; is it possible to master the above subjects through self-study with the theory as given in the pre-master? I have been given the material by students who are currently following the pre-master.
Kind regards, Rik Peeters Software Engineering & Cyber
*- Through the following email I came into contact with joris geurts. After personal consultation he has given permission to attend classes related to the tav course. In doing so, I came into contact with the teachers who teach the tav classes. they have guided me and increased my knowledge
Thank you for reading this topic about statistics I hope it was interesting any feedback is always welcome. Hope to see you in the next topic,
Byee! 👋🍺
TL;DR Basic knowledge building for preparation master studies. Here I learn to perform statistical analysis and draw conclusions